

Create your bar chart image
Enter comma-separated labels and values, pick colors and size, then download the PNG or copy the dynamic chart URL.
The chart, the heading and the footnote in one render
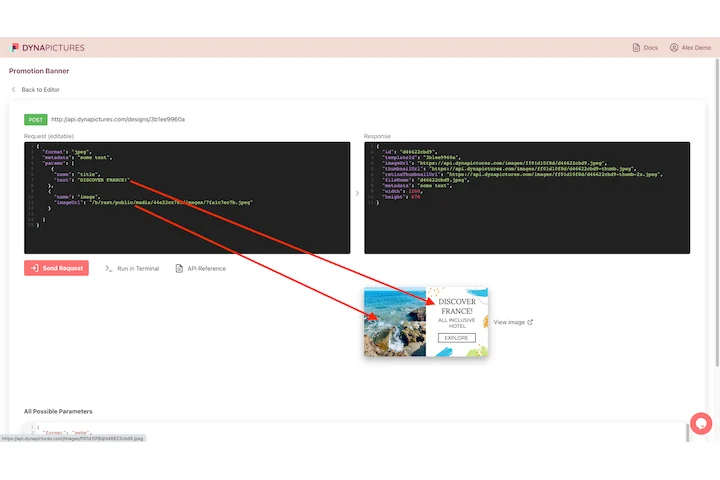
A chart is one element on a report page, which also carries the client name, the period covered and the note about where the numbers came from. In DynaPictures the chart is a layer inside that page, so one request sends the labels and values with the surrounding text and the finished page comes back as PNG or PDF.
How to convert chart data to an image
Enter labels and values
Type the categories and numbers, one per bar, up to 12 bars. Decimals and negative values are fine.
Style the chart
Choose the bar color, background and text colors and the output size in pixels. The preview updates as you type.
Download or copy the URL
Save the PNG, or copy the dynamic URL and change labels= and values= in it whenever the data changes.
Why generate chart images here
No charting library
Nothing to install or bundle; the chart is a plain PNG rendered on our servers.
Data in the URL
Put labels and values in the query string and every fetch draws the chart from those numbers.
Works in email and Markdown
Because it is an image, the chart shows in HTML emails, Notion, Slack and GitHub READMEs where scripts do not run.
Up to 12 bars
Enough for weekdays, months or a dozen categories while staying readable at email width.
Your colors and size
Match brand colors with hex values and set the exact pixel size your layout needs.
How the chart image URL works
Every chart you build has an id. Requesting /tools/d/YOUR-ID.png with labels= and values= parameters makes our renderer draw a bar chart from those lists and return a PNG; the colors and size you chose are baked into the id. Separate items with commas and URL-encode any label that contains spaces. This free tool draws bar charts only. The DynaPictures platform is where you design richer templates, with line or pie style charts, logos and text, generated through the API, Zapier, Make or a spreadsheet.
Free limits
20 renders per day per visitor. Each dynamic URL serves up to 1,000 views or 30 days, then shows a small upgrade notice.
Beyond bar charts
The DynaPictures platform renders your own chart templates with logos and text from the API, Zapier or Make.
Data format
Comma-separated lists, for example labels=Q1,Q2,Q3 and values=120,95,143, with the same number of items in both.
<img src="https://api.dynapictures.com/tools/d/YOUR-ID.png?labels=Mon,Tue,Wed&values=12,19,7" alt="Signups">Frequently asked questions
Up to 12 bars per chart. Provide the same number of labels and values, separated by commas.